
Dedicated to the 2021 World Hydropower Congress, this Brief provides a review of hydropower development in 2020 and rich statistics on hydropower in the 21 century. It notes a modest role of hydropower in renewable energy (RE) revolution, global decline in annual hydropower expansion for the last 7 years. Section contains a brief account of relative advantages and disadvantages of hydropower as a part of “sustainable development”. It further assesses national policy environment for current hydropower development in dam-developing countries, exploring violations of internationally recognized ESG standards and safeguards. The report further explores sustainability at project level and contains overview of risks and potential damages for 90% of large hydro put online in 2020. Report has special part on pumped storage technology, possessing promising characteristics, which now faces uncertain future due to higher costs of construction and demonstrated lack of environmental safeguards.
CONTENTS:
II.SNAPSHOT ON HYDROPOWER INSTALLED IN 2020 AND TRENDS BEHIND IT. 2021.09.21
III.PERSISTENT PROBLEMS IN HYDROPOWER DEVELOPMENT IN CHAMPION COUNTRIES. 2021.09.22
IV.“PARADE OF THE CHAMPIONS”: 2020 HYDROPOWER EXPANSION IN SELECTED COUNTRIES AND ITS COSTS.2021.09.23
V.WELCOME THE PUMPED STORAGE..and CONCLUSION. 2021.09.24
PART I. HYDRO HAS A MODEST ROLE IN RENEWABLE ENERGY REVOLUTION. GLOBAL HYDROPOWER EXPANSION DYNAMICS
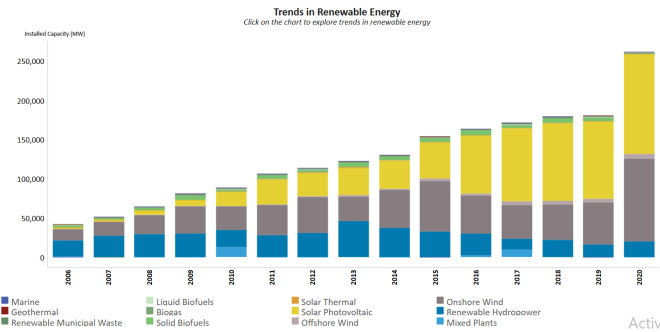
According to IRENA, in 2020 RE generation capacity increased by 261 GW (+10.3%) and amounted to 2799 GW. Solar accounted for 714 GW with an increase of 127 GW (+22%) and wind energy with 733 GW with 111 GW (+18%), continued to dominate RE capacity expansion, jointly accounting for 91% of all net RE additions in 2020. Hydropower capacity has increased by 20-21 GW (+2%), making global conventional hydropower reach 1211 GW (not counting 121 GW of pure pumped-storage hydropower, which does not produce energy). Addition in hydropower in 2020 amounted to less than 8% of all increase in RE.
Figure 1: 2006-2020 Global annual additions of RE capacity (IRENA)
GLOBAL HYDROPOWER EXPANSION DYNAMICS
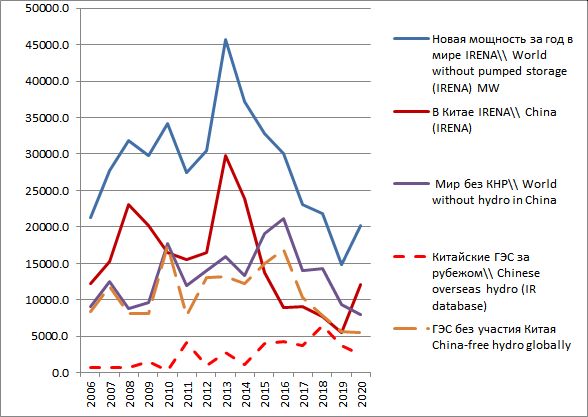
We traced annual expansion of hydropower showing its relative decline during last 7 years. Figure 2.1. omits “pure” pumped storage plants, which are energy storage facilities and do not generate electricity. China has been the absolute champion responsible roughly for half of new hydropower globally and till 2019 displayed the sharpest decline in new hydro. Some increase in 2020-23 is due to completion of several megadams in China (Figure 2.2.). At least till 2018 there was also increase in capacity built with Chinese assistance in other countries. Thus, in 2018-2020 more than 70% of hydropower capacity added globally was installed thanks to Chinese companies and financiers.
Figures 2.1 and 2.2. Annual globally installed hydropower
(International renewable energy Agency (IRENA)-left, International Energy Agency (IEA) predictions -right)
 |  |
From 240 countries reporting on progress in RE to IRENA in 2020: only 46 countries added some hydropower capacity in 2020 (International Hydropower association(IHA) lists only 35 such countries, US Department of Energy (DoE) lists projects under construction in 66 countries as of December 2019); 77 countries reported not having any hydropower (definitely not “energy for all”); 117 countries did not add any new capacity either through greenfield projects or upgrades; in 7 of those capacity decreased. Several countries deliberately removed from plans or restricted new projects (e.g. Bulgaria, Bosnia, Montenegro, etc.). All in all only 25-30 % of countries are developing new hydropower. The pace of greenfield hydropower development (comprising 4-7% of annual additions in new RE capacity) leaves it little chances to make any significant contribution to “the renewable energy revolution”.
According to the US DoE, the global development pipeline by the end of 2019 included 4,545 hydropower projects with total capacities of 414 GW. South Asia and Southeast Asia and Oceaniahave by far the largest number of projects—more than 600 each—but their average capacity is significantly lower than for the projects in East Asia. In total, at the end of 2019, 117 GW of hydropower were being constructed in 616 projects across 66 countries. China accounted for 55% of hydropower capacity under construction (64 GW). Additionally, there were 297 GW of hydropower in different phases of scoping, permitting, and development.
US DoE claims that if all hydropower and pumped storage hydropower (PSH) investment projects in the global pipeline at the end of 2019 are completed, they represent an estimated expenditure of $1.1 trillion (of those, PSH projects required 270 billion). This total includes investment in new plants as well as expansions (e.g. addition of new turbine-generator units to existing plants) and refurbishments and upgrades (R&U) of existing units. It also includes both projects already under construction and those in the planning and permitting stages.
Figure 3. Map of “global hydropower pipeline”
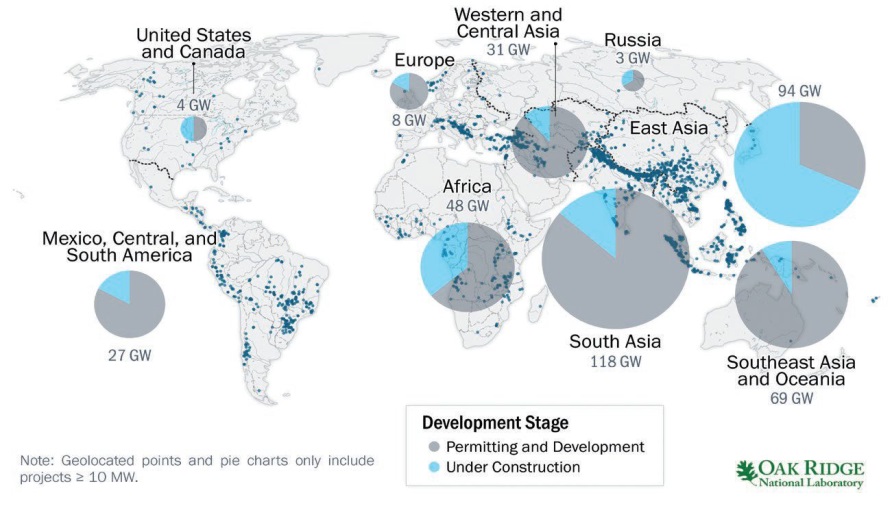
Source: US DoE, 2021 Hydropower Market Report.
More than 90% of global expenditures are directed toward development of new plants. Tracked capital investment needs in plant expansions and R&U at the end of 2019 totalled $42 and $31 billion respectively. If annual global expenditures for hydropower construction stay at $15-20 billion annually, then fulfilment of existing expansion plans will take 40-50 years. If alternatively we optimistically extrapolate into the future the development pace observed in 2015-2020, then 400+GW may be installed in 20 years. However, it would take 2-5 years to develop similar capacity using wind and solar projects at significantly lower costs.
The future of hydropower expansion is subject to high uncertainty due to many critical factors such as:
- -increasing costs per kW installed capacity,
- increasing LCOE (price per KWh) in most countries of the world as opposed to rapidly decreasing LCOE of alternatives;
- -much greater cost and time of project construction than for most other RE;
- -high likelihood of time\cost overruns;
- -acute conflict between hydropower projects and local communities, whose living environmental and resources those projects degrade;
- -decreasing availability of suitable sites at rivers
located near electricity consumption centers;
- -increasing risk of underperformance and catastrophic events due to climate change;
- -huge negative impacts on biodiversity and ecosystem functions at planetary scale;
- -increasing competition for water resources between all sectors of economy and overarching need to preserve key ecosystem services, that forces to prioritize water-use types, which have no practical alternatives (while hydropower has plenty of viable alternatives virtually everywhere).
- -ageing dams around the world with mounting legacy problems and increasing risks of dam failures force responsible governments and companies to prioritize refurbishment and upgrades (and expansion) of existing facilities to greenfield development;
- -already high proportion of hydropower in RE fleet in many developing countries makes their energy systems unbalanced and vulnerable to many problems listed above, forcing those states to expand other RE sources to make energy systems more reliable.
At the same time hydropower still has several important selling points:
- -ability to provide manoeuvring capacity and other essential services to national energy systems and increasing recognition of their value by energy markets;
- -still somewhat lower LCOE compared to most RE sources in some regions and low recurrent costs due to low water prices, lack of lasting compensation mechanisms for environmental and social impacts and, often, disregard to accumulating technical problems;
- -corruption-prone model of dam development attractive for officials in countries with defunct governance systems;
- -potential for multi-purpose use of reservoirs promises benefits additional to electricity generation, which is often not fulfilled once the dam is built;
- -high symbolic value of dams making them focus of national development policies;
- -inertia and self-preservation efforts of large construction and equipment-manufacturing industry focused on new hydropower development;
- -inertia of multilateral and bilateral development finance institutions which prefer to support “large-scale” investment projects;
- -longevity of projects: once built, a large dam may last for 60-120 years;
- highly questionable, but officially widely recognized “low-emissions” status of hydropower, which is partly due to poor accounting of climate-related trade-offs with disruption in ecosystem services and decline in biodiversity and, partly, due to disregard to time-bound climate targets when spreading emissions occurring at initial stages over the full-life-time of the project.
Hydropower still has a huge appeal for variety of influential decision-makers and institutions and has a potential to persist in development agenda, especially in the context of strengthened authoritarian regimes and constrained access to decision-making both for expert community as well as civil society organizations and affected communities.
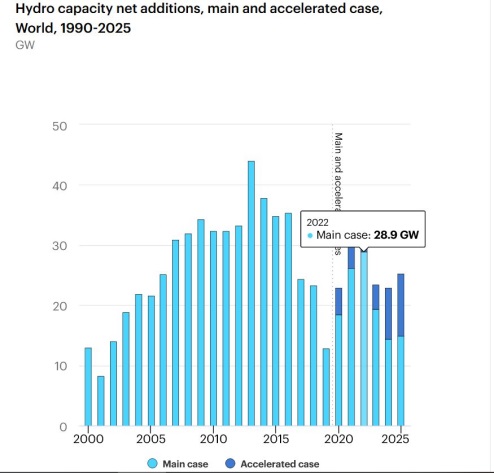
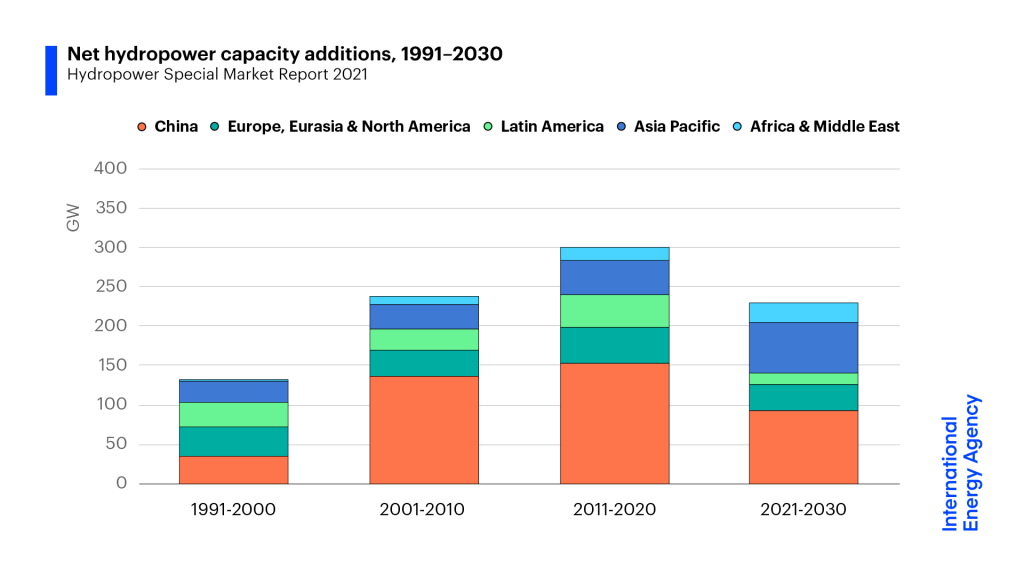
However even major proponents of hydropower development known for overoptimistic forecasts fully recognize that hydropower development globally has passed its peak and faces decline (Figure 4).
Figure 4. Hydropower statistics by regions and forecast till 2030 by the IEA.
Published in the “Water Yearbook: Central Asia and around the Globe-2020”, SIC ICWC, Tashkent 2021
Compiled by Eugene Simonov, Rivers without Boundaries International Coalition (RwB).