
(Full Contents of Hydropower Policy BRIef here)
Our analysis for 2020 is based on two annual reports: “Renewable Capacity Statistics 2021”[1] by IRENA and “Status of Hydropower Report” by the International Hydropower Association (IHA). We reviewed data on the countries adding more than 100 MW, according to at least one of two reports (Table 1). For either IRENA or IHA version our review covers 90% of capacity installed in 2020.
Table 1. Countries installed more than 100 MW hydropower in 2020 (“Hydropower Champions”)
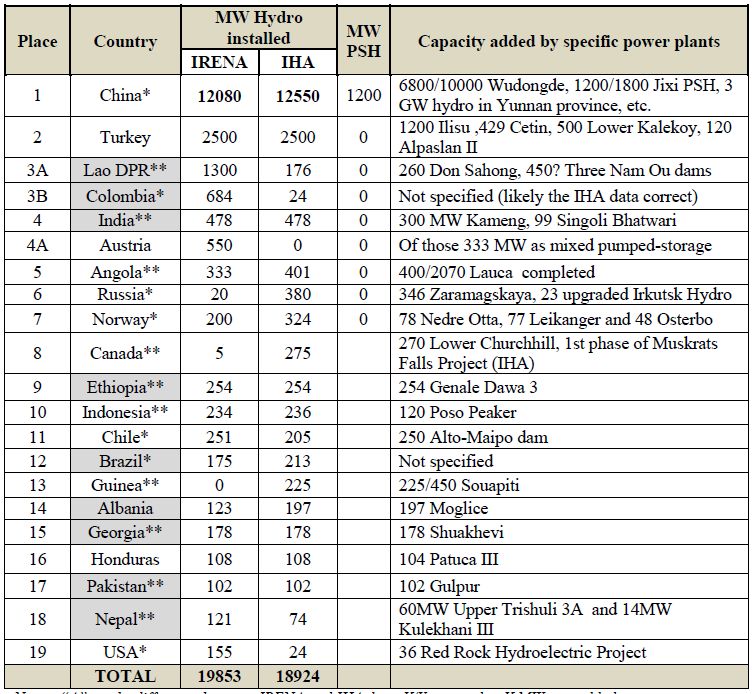
Notes: “A” marks difference between IRENA and IHA data. X/Y means that X MW was added to a project with Y full planned capacity.
Legend: * marks the countries shifting from overreliance on hydropower; ** marks the countries maximizing hydropower development; Grey filling – the countries that have recently experienced major economic or political problems due to high reliance on hydropower.
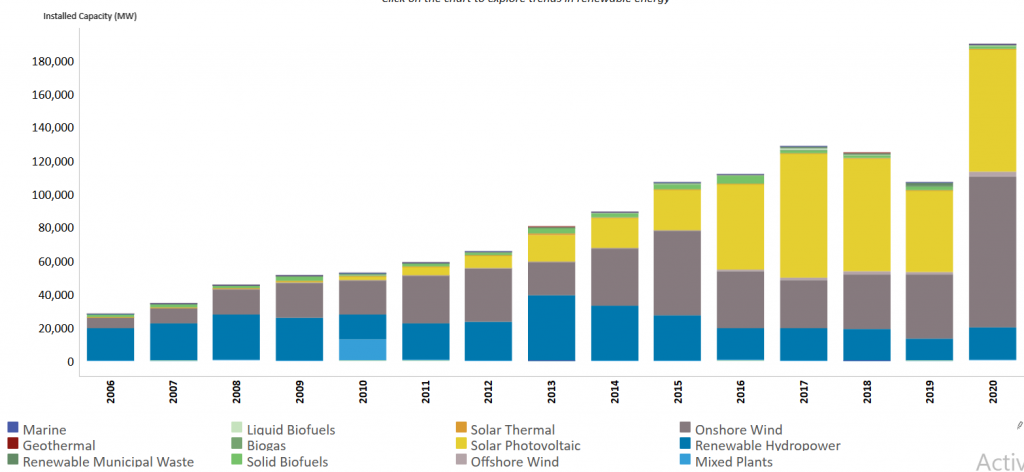
Even among the leading countries hydropower is no longer the preferred type of RE expansion. Hydropower in 2020 contributed only 10% to the RE cumulative additions in all those 21 countries-champions (see Figure 5).
However, real trends differ from country to country. In the table above, we used grey filling to highlight those countries, which had recently experienced major economic or political problems due to high reliance on hydropower (e.g. Georgia and Nepal have extreme seasonal deficit in energy generation forcing them to import energy from neighbours). We asterisked those countries, which despite large hydropower installation are explicitly seeking to move away from overreliance on hydropower (Brazil and Colombia being most recent examples). A double asterisk is used to mark the countries, which pursue the opposite policy of maximizing hydropower development, despite best available evidence on related problems (e.g. Laos strangled by debts related to hydropower construction or Ethiopia risking political isolation due to its neighbours feeling threatened by development on transboundary rivers).
Figure 5. The 21 countries “hydro-champions” in 2020s installed much more solar and wind energy than hydropower (IRENA)
Those divergent trends, likely, will continue in future reinforced by external influences from larger countries and transnational corporations. The countries, which currently have the longest “hydropower pipelines”, are not necessarily those having best technical or financial capacity to build hydro. Two thirds of the top 20 countries planning hydropower (Table 2) heavily rely on foreign hydropower firms, which open possibilities for increase in projects implemented overseas by Chinese, Turkish, Norwegian, Iranian, US, Russian and EU companies.
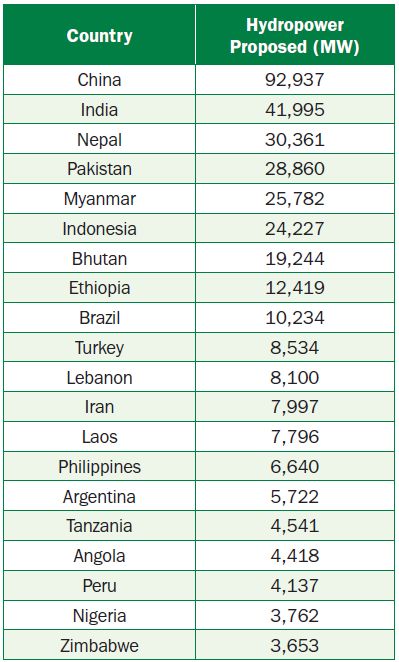
Table 2. Top-20 “hydropower-planning” countries as of January 1, 2020. Source: US DOE, 2021 Hydropower Market Report.
However, those development opportunities are met with growing restraint by international and domestic investors, a trend illustrated below by data on Belt and Road Initiative finance.
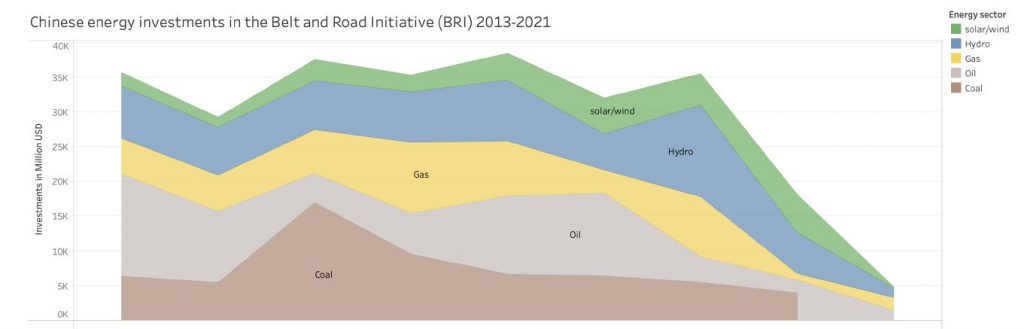
Figure 6. This chart from the China Belt and Road Initiative Investment Report published in July 2021 by Dr. Ch. Nedpoil Wang
(GRBIC) China’s overseas investments in large hydropower are in sharp decrease.
One of reasons for growing restraint in financing hydropower is rapid increase in cost of finance for hydropower, while it is falling for wind and solar. A study published in April 2021 by Oxford Sustainable Finance Programme showed that over decade the financing costs for coal-fired power plants have increased on average by 38% and for hydropower by 30%, while for wind power and solar PV it was falling. The study also attempts comparison across regions, indicating dramatic rise in costs of hydropower loan servicing in Latin America and relative decrease in ASEAN countries.
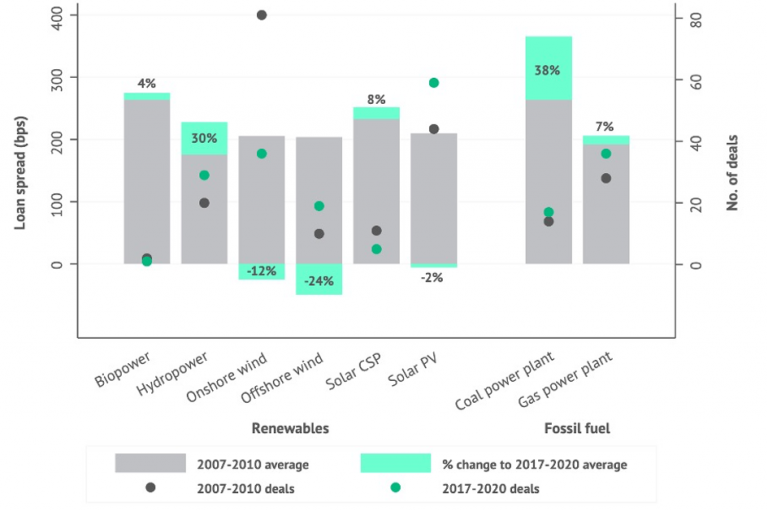
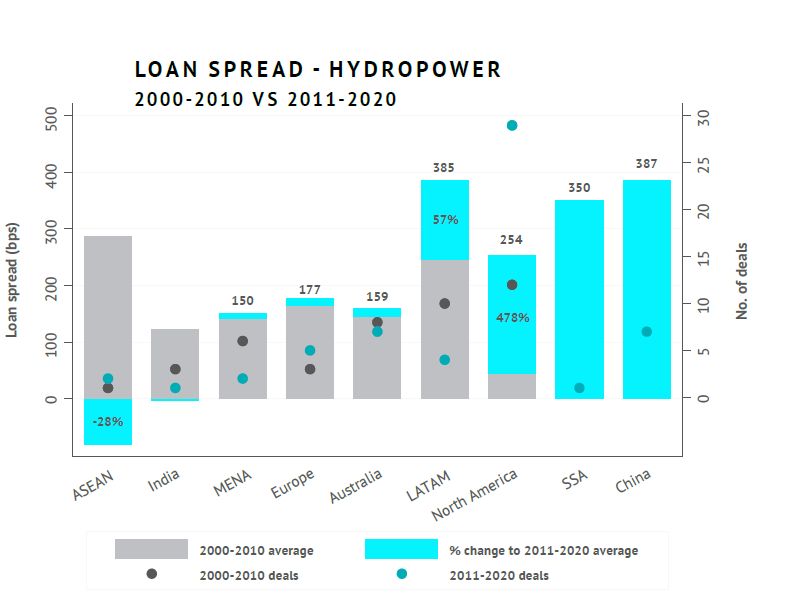
Figure 7. Loan spread graphs show changes in cost of finance in energy sector. Source: Significant fall in cost of financing renewable energy projects. Oxford Sustainable Finance Programme
Oxford scientists examine financing costs by analysing syndicated bank loan spreads taken from LPC DealScan, which includes loan information on 12,072 loan deals between 2000 and 2020, involving 5,033 borrowers across 118 countries in the energy and electric utilities sectors as identified by The Refinitiv Business Classification (TRBC). Since the report primarily explores how the cost of debt for fossil fuels and renewables have changed internationally over the past 20 years it provides quite impartial assessment for hydro, since it is marginal to the author’s interests and value judgements focused on fossil fuels.
Increasing attempts of hydropower industry to present hydropower as “green energy” are aiming at reducing cost of finance by granting to dam projects access to “climate finance” and “green bonds” markets. In 2020, the International Hydropower Association succeeded in issuing hydropower standard for “Climate Bond Initiative”, which may give their members access to cheaper money to refinance hydropower projects.
Published in the “Water Yearbook: Central Asia and around the Globe-2020”, SIC ICWC, Tashkent 2021
Compiled by
Eugene Simonov, Rivers without Boundaries International Coalition (RwB).
[1] https://www.irena.org/publications/2021/March/Renewable-Capacity-Statistics-2021