


(Full Contents of Hydropower Policy BRIef here)
As for the pumped storage hydro (PSH), much hyped as a remedy for grid stability and flexibility, which also usually has less destructive footprint, only 1633 MW were put in operation in 2020, despite all hopes trumpeted by hydropower industry and personally by former Australia PM Malcolm Turnbull. In practice this means that most countries balance uneven output of ‘variable renewables” by other means ranging from building batteries to smart use of large grids (See Hydropower Market Report with such analysis for the US hydro and PSH).
A map published by the US DoE shows the global PSH pipeline as traced by US Oak Ridge Labs (Figure 8). The global development pipeline by the end of 2019 included 284 PSH projects with total capacities of 226 GW. At the end of 2019, according to the US DoE, 13 countries were constructing 50 PSH projects with total capacity of 53 GW. Additionally, there were 173 GW of PSH in different phases of scoping, permitting, and development.
Figure 8. Map of global PSH pipelines
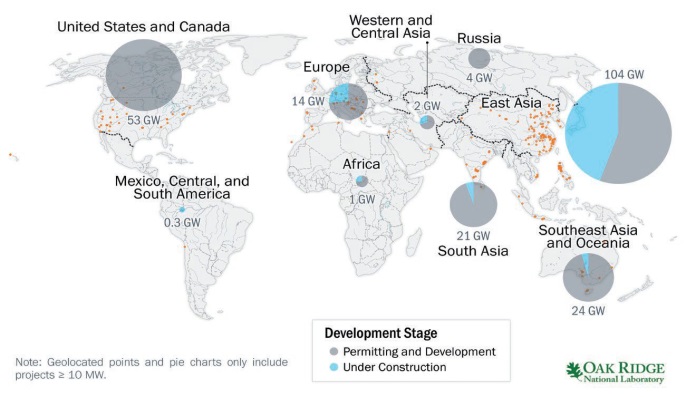
Source: US DoE, 2021 Hydropower Market Report.
[1] “Closed –loop PHS” presumes that neither upper nor lower reservoir is developed by alteration of natural stream or lake.
Almost everyone agrees that in principle the PSH is the most promising of all hydropower technologies. Researchers from the Australian National University developed geographic information system algorithms to catalogue potential closed-loop[1] PSH sites around the world. In 2019, they published a global atlas of the 616,000 locations identified in their analysis, with a combined energy storage capacity of approximately 23 million GWh (http://re100.eng.anu.edu.au/global/). Although only a small portion of the identified sites would ultimately be viable once more detailed geological and environmental studies are conducted, the authors estimate that developing as few as 1% of the identified energy storage capacity would be enough to fulfill the storage requirements of a global grid with 100% renewables. However, something is preventing the PHS from developing at pace corresponding with needs of RE development. An average 2.3 GW was developed annually since 2005 without any increase (Figure 9).
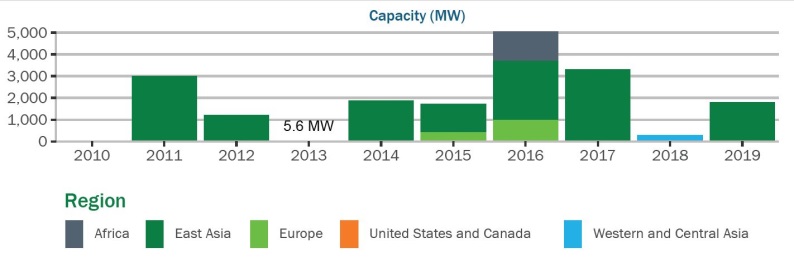
Figure 9. PSH installation over last decade has been uneven.
Source: US DoE, 2021 Hydropower Market Report.
China accounted for 87% of PSH planned capacity with 46 GW under construction. Only 1.2 GW were installed in 2020 as three turbines at the Jixi Pumped Storage in 2020. China’s 13th year plan is ending with completion of less than 40% of planned 35 GW expansion of PSH fleet. China PSH pricing mechanism released in April 2021 suggested all pumped storage plants in China to adopt a two-part tariff mechanism based on capacity and energy tariff after 2023.
Other 300 MW was installed in northern Israel at Gilboa PSHand, according to IRENA, 115 MW were added in the United States.
As for environmental and social impacts, relatively few concerns have been voiced in relation to the PSH projects. Decades ago Russia proposed a 1 GW PSH in Tver Region which would negatively affect the Tsentralno-Lesnoy Strict Nature Reserve, but that proposal long ago faded away without a trace. Australian PM Turnbull authorized an irresponsible scheme of 2 GW PHS development called Snowy-2, based on existing hydro inside the most iconic Kosciusko National Park of Australia, which was planned and pushed through EIA without credible mitigation measures. Now this unfortunate development will serve as repellent for investors into this otherwise benign technology. Project pipeline advertised by investors includes new large PSH projects presenting high unassessed potential threats, such as “Battery of the Nation” Scheme encircling Tasmania Wilderness World Heritage Site in Australia and several dams proposed on indigenous lands upstream of Grand Canyon World Heritage in the USA.
Less
than 2 GW of PSH added globally in 2020 may signify that this technology is
still less attractive than battery and grid-based solutions to boost energy
system flexibility. Given fresh experience with the irresponsible Snowy-2
project civil society and environmental organisations, would be less eager to
speak in support of this technology. To regain popular support the pumped hydro
proponents need to adopt the strictest environmental and social standards,
especially for site-selection planning process, and demonstrate in practice
that this technology enables RE revolution without destruction of nature and does
not present just another unsustainable business as usual.
CONCLUSION:
This report demonstrates that most of current hydropower development happens in countries not possessing at policy level sufficient safeguards and is associated with very high risks and a potential damage, which is vividly exemplified by 90% of large hydro put online in 2020. Financial viability of hydropower projects has been rapidly decreasing due to increasing construction and energy production costs as well as increase in cost of capital. Climate resilience of existing hydropower fleet happened to be lower than expected with many countries suffering from overreliance on hydropower in times of droughts and large floods. The industry is still trying to overcome difficulties by exploiting “climate” theme in an attempt to capture cheaper climate finance and has made some progress with support of the “Climate Bonds Initiative”.
Pumped storage hydropower technology, despite its promising characteristics, faces uncertain future due to higher costs of construction and lack of environmental safeguards displayed by its flagship project “Snowy-2” in Australia. However, closed-loop pumped storage built outside of sensitive natural areas still has a chance of revival, given vast choice of potential locations available on each continent. It is unlikely to regain credibility unless its environmental and social impacts are subjected to analysis and public discussions from early stages of project identification.
KEY REFERENCES:
International Rivers and RwB 2020. Rivers for Recovery Report. https://www.rivers4recovery.org/
US DoE, 2021 Hydropower Market Report. https://www.energy.gov/eere/water/hydropower-market-report
International Hydropower Association 2021. Status of Hydropower Report. www.hydropower.org
IRENA 2021. Renewable Capacity Statistics 2021” https://www.irena.org/publications/2021/March/Renewable-Capacity-Statistics-2021
Oxford University 2021. Significant fall in cost of financing renewable energy projects. https://www.smithschool.ox.ac.uk/news/articles/210419-significant-fall-in-cost-financing-renewable-energy-projects.html
United Nations University Institute for Water, Environment and Health (UNU-INWEH). “Ageing Water Infrastructure: An Emerging Global Risk” https://inweh.unu.edu/ageing-water-storage-infrastructure-an-emerging-global-risk/
Hydropower in the European Green Climate Finance Taxonomy. https://ec.europa.eu/info/law/better-regulation/have-your-say/initiatives/12302-Sustainable-finance-EU-classification-system-for-green-investments/F1345685_en
Citation: E. Simonov, Hydropower Development in 2020: Global Trends. Chapter 12.4 in the “Water Yearbook: Central Asia and around the Globe-2020”, SIC ICWC, Tashkent 2021
LINKS TO PUBLICATION ONLINE: http://cawater-info.net/yearbook/12_yearbook2020_04_ru.htm
In English: http://cawater-info.net/yearbook/12_yearbook2020_04_en.htm,
PDF RU http://cawater-info.net/yearbook/pdf/12_yearbook2020_ru.pdf,
PDF EN http://cawater-info.net/yearbook/pdf/12_yearbook2020_en.pdf https://www.researchgate.net/publication/354544774